
AI Search Statistics 2026: Clicks, Conversions & Brand Visibility

AI search reached mass scale in 2026: Google AI Overviews passed 2.5 billion monthly users, AI Mode passed 1 billion, and ChatGPT reached about 1 billion weekly users. Clicks have not kept pace. Ahrefs measured a 58% lower position-one CTR on keywords with an AI Overview, while Adobe found AI-referred retail visitors converted 42% better than other traffic in March 2026.
This Freeways Agency analysis compiles the most decision-relevant AI search statistics of 2026 from Google, OpenAI, Pew Research Center, McKinsey, Adobe, Ahrefs and Seer Interactive, alongside Freeways' own test of 216 brands in the United States, Canada and Australia, which found that 18% of AI answers mentioning a brand contained a factual error. Each figure keeps its original source, measurement period and sample. Full methodology is at the end of this article.
Key AI search statistics (2026)
Statistic | Source | Measured | Scope |
|---|---|---|---|
Google AI Overviews: 2.5B+ monthly users | May 2026 (I/O) | Global | |
Google AI Mode: 1B+ monthly users | May 2026, reaffirmed Jul 2026 | Global | |
ChatGPT: ~1B weekly active users | OpenAI | Jul–Aug 2026 | Global |
Gemini app: 1B+ monthly active users | Aug 2026 | Global | |
Generative AI websites: 9.5B average monthly visits, +70% YoY | Similarweb | Jun 2025–May 2026 | Global web |
Position-one CTR is 58% lower on keywords with an AI Overview | Ahrefs | Dec 2023 vs Dec 2025 | 300,000 keywords |
Organic CTR with an AI Overview rebounded from 1.3% to 2.4% | Seer Interactive | Dec 2025–Feb 2026 | 53 brands, 2.43B impressions |
Cited in AI Overview: ~2.1% CTR vs ~0.9% when not cited | Seer Interactive | Jan 2025–Feb 2026 | 53 brands |
Traditional-result clicks: 8% with an AI summary vs 15% without | Pew Research Center | Mar 2025 | 900 U.S. adults |
Clicks on a source inside the AI summary: 1% of visits | Pew Research Center | Mar 2025 | 900 U.S. adults |
AI summaries on 53% of 10+ word searches vs 8% of 1–2 word searches | Pew Research Center | Mar–Apr 2025 | U.S. Google searches |
50% of consumers intentionally use AI-powered search | McKinsey | Aug 2025 | 1,927 U.S. respondents |
AI-referred retail traffic converted 42% better than non-AI traffic | Adobe Digital Insights | Mar 2026 | U.S. retail sites |
AI retail traffic grew 393% YoY | Adobe Digital Insights | Q1 2026 | U.S. retail sites |
Only 16% of brands systematically track AI search performance | McKinsey | Sep 2025 | ~30 Fortune 500 CMOs |
Branded web mentions correlate 0.664 with AI Overview visibility (backlinks: 0.218) | Ahrefs | May 2025 | Established domains |
13.7% citation overlap between AI Overviews and AI Mode | Ahrefs | Sep 2025 | 540,000 query pairs, U.S. |
18% of AI answers mentioning a brand contained a factual error | Freeways Agency | Oct 2026 | 216 brands in the U.S., Canada and Australia; 4,320 prompts; 5 platforms |
How big is AI search in 2026?
AI search now reaches billions of people a month, and Google's own AI surfaces are the largest by reach.
Google AI Overviews passed 2.5 billion monthly users, announced at Google I/O in May 2026.
Google AI Mode passed 1 billion monthly users within a year of launch; Google said its query volume had doubled every quarter.
Gemini app passed 1 billion monthly active users in August 2026, up from about 400 million in May 2025.
ChatGPT reached about 1 billion weekly active users in mid-2026.
Generative AI websites averaged 9.5 billion monthly visits between June 2025 and May 2026, up 70% year over year (Similarweb).
Perplexity processed 780 million queries in May 2025, according to its CEO.
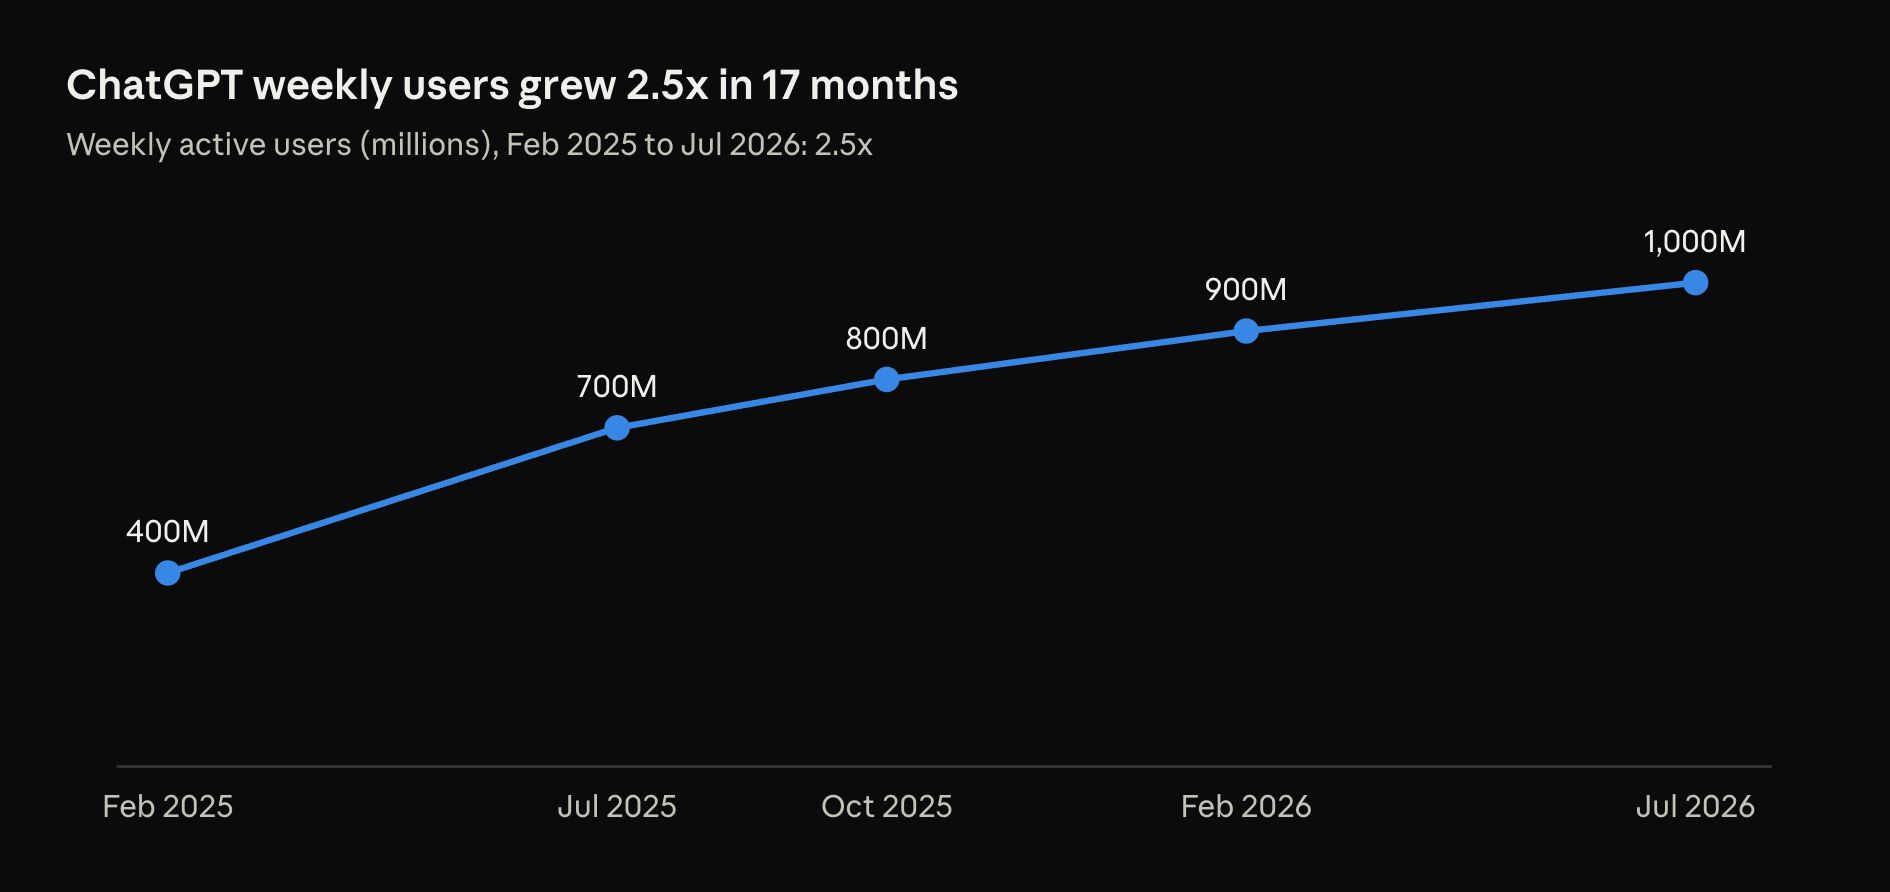
These figures use different definitions (weekly vs monthly users, users vs visits), so they should not be added together or ranked directly. Google still handles the large majority of web searches; AI search is growing alongside it rather than replacing it.
How do consumers use AI search?
Half of U.S. consumers now choose AI-powered search on purpose, and most use it early in the buying journey.
50% of consumers in McKinsey's U.S. survey intentionally sought out AI-powered search (1,927 respondents, August 2025).
More than 70% of AI-powered search users asked top-of-funnel questions about categories, brands, products or services (McKinsey).
53% of Google searches with 10 or more words showed an AI summary, compared with 8% of one- or two-word searches (Pew Research Center, U.S., 2025).
Google AI Mode queries average about three times the length of conventional searches, according to Google.
What it means: buyers ask longer, more specific questions before they contact a vendor. A keyword list misses many of these. Freeways recommends building a prompt set from real sales and support questions, grouped by stage: understanding the problem, comparing approaches, and checking product fit.
Do AI answers reduce clicks to websites?
Yes, but the loss is uneven: pages cited in an AI Overview keep far more clicks than pages that are not.
58% lower position-one CTR on keywords with an AI Overview, December 2023 vs December 2025; position two lost about half its clicks and position ten nearly 20% (Ahrefs, 300,000 keywords).
8% vs 15%: share of Google visits with a traditional-result click, with and without an AI summary (Pew Research Center, March 2025).
1% of visits to a page with an AI summary included a click on a source inside the summary (Pew).
1.3% to 2.4%: organic CTR on AI Overview queries rebounded between December 2025 and February 2026, an 85% recovery from its low (Seer Interactive).
2.8% to 3.8%: organic CTR on queries without an AI Overview rose over the same 14 months, so those queries are becoming more valuable (Seer).
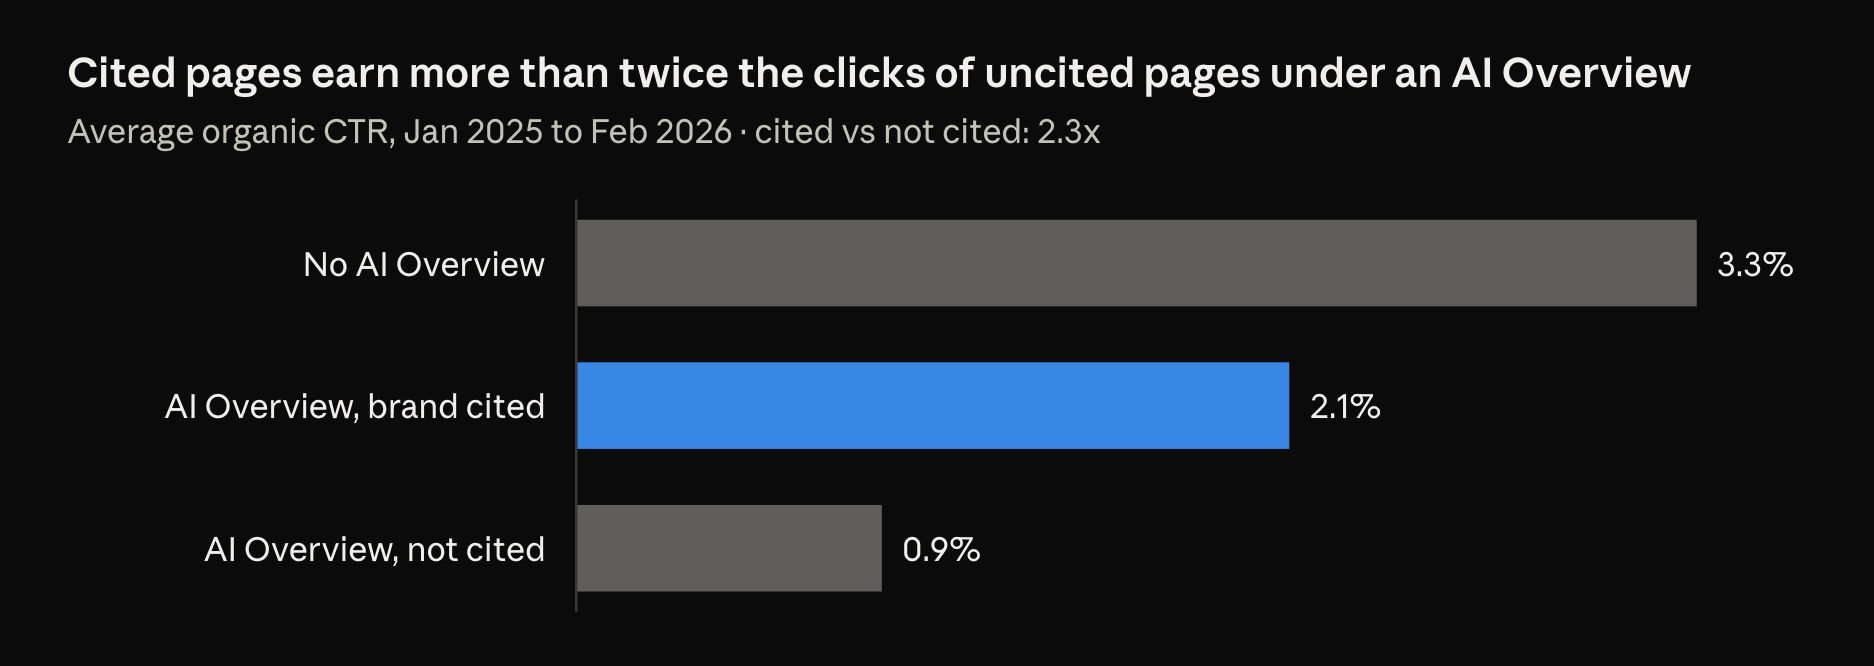
What it means: ranking alone no longer predicts traffic. Track citation status for priority queries, and report citations, rankings and visits as separate metrics.
Is traffic from AI platforms valuable?
In U.S. retail, AI-referred visitors now convert better than average, but results differ sharply by industry.
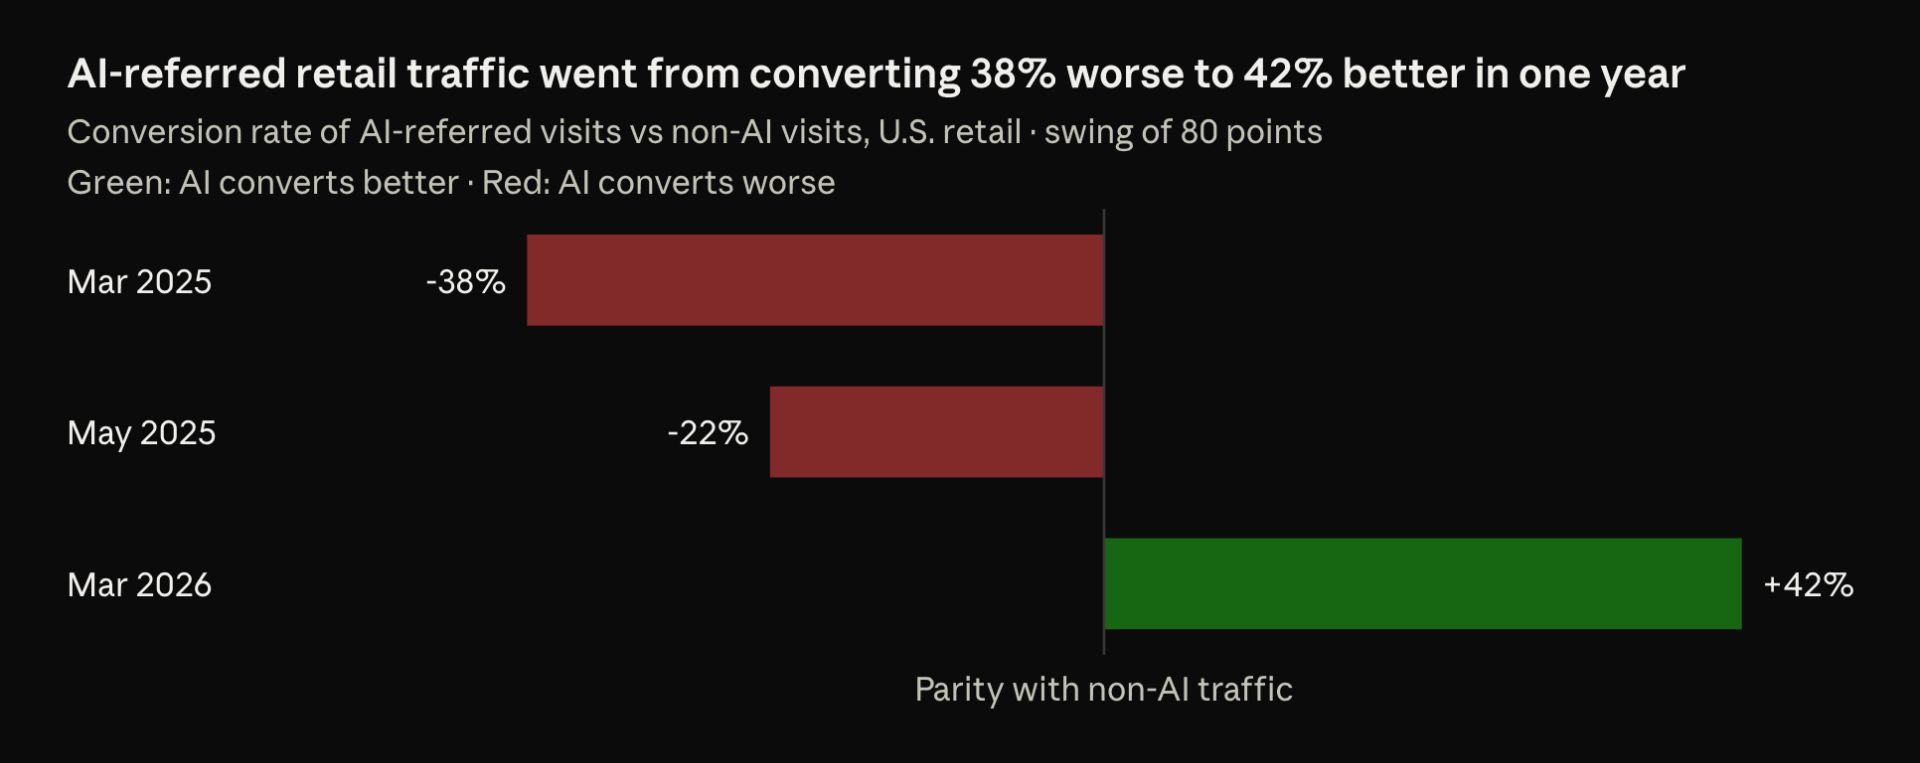
393% year-over-year growth in AI traffic to U.S. retail sites in Q1 2026 (Adobe).
37% higher revenue per visit, 48% more time on site and a 12% higher engagement rate for AI-referred retail visitors in March 2026 (Adobe).
Industry matters: in May 2025, Adobe found AI visitors converted 49% below non-AI traffic in travel, while banking application starts were 7% higher. Application starts are a different outcome from purchases.
What it means: an external benchmark cannot tell you whether AI traffic is valuable for your business. Compare AI referrals with other channels in your own analytics, over the same period, using the outcome that matters to you: purchases, qualified leads or activations. Report session volume too; a high conversion rate on a few dozen visits proves little.
What drives visibility in AI answers?
How often and how accurately a brand is discussed across the web matters more than classic link signals, and each AI platform picks different sources.
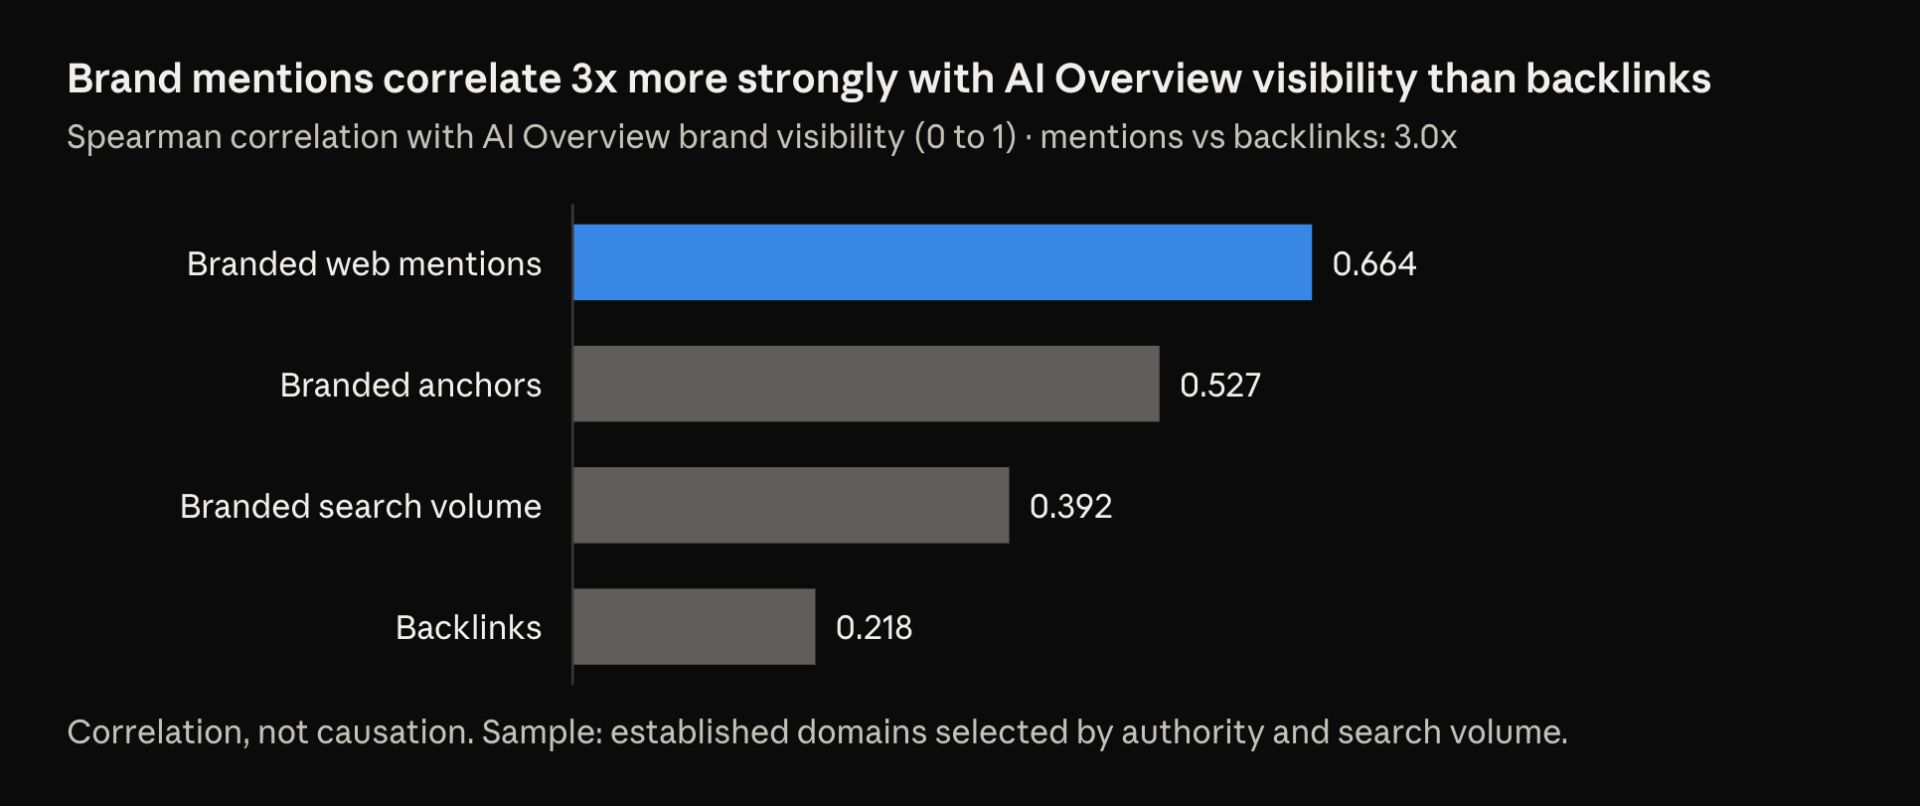
YouTube mentions were the signal most strongly correlated with AI visibility across 75,000 brands in Ahrefs' Q1 2026 AI Search Benchmark Report.
~28% of the 1,000 pages ChatGPT cited most often in September 2025 had no organic search visibility in Ahrefs' data, so Google rankings do not guarantee AI citations.
13.7% citation overlap between Google AI Overviews and AI Mode, even though their answers had 0.86 semantic similarity (Ahrefs, 540,000 query pairs, U.S., September 2025).
75%, 74% and 66%: average AI-readability scores for U.S. retail homepages, category pages and product pages in Adobe's diagnostic. Product pages, the most commercial, scored lowest.
What it means: audit where and how your brand is described off-site, not only on your own pages. Track each AI platform separately, and check that product pages state specifications, pricing conditions and limitations in plain text.
How consistently do brands appear across AI search platforms?
Freeways Agency tested how 216 brands across 12 industries in the United States, Canada and Australia appear in AI answers, using 4,320 distinct buyer prompts on five AI search experiences in October 2026.
18% of answers mentioning a tested brand contained at least one factual error, such as an outdated price, a discontinued product or a wrong service area.
62% of answers recommending a tested brand cited none of that brand's own pages.
25% of the brands tested appeared in answers to their main category prompt on all five platforms in the first test run.
On average, 34% of unique cited URLs appeared in all three repeated runs of an identical prompt on the same platform.
Metric | ChatGPT | Gemini | Google AI Overviews | Google AI Mode | Perplexity |
|---|---|---|---|---|---|
Brand mention rate (%) | 42 | 38 | 26 | 35 | 45 |
Accurate description rate (%) | 82 | 79 | 88 | 84 | 80 |
Brand-owned URL cited (%) | 36 | 29 | 33 | 40 | 52 |
Average sources cited per answer | 5.2 | 3.4 | 4.8 | 7.1 | 6.5 |
How Freeways measured it
Twenty prompts per brand were built from real sales and support questions: 7 awareness prompts, 7 comparison prompts and 6 fit prompts. Each brand's main category prompt was included in its awareness set.
The 4,320 distinct prompts were each run three times on each of the five platforms, producing 64,800 scheduled test outcomes. Tests were conducted using market-specific locations in the United States, Canada and Australia, with each brand evaluated in its assigned target market. Logged-out sessions were used where available, and the test location, date, platform, mode, account state and available settings were recorded.
An answer counted as accurate only if every verifiable factual claim about the tested brand matched its official pages on the test date. Statements that could not be verified were flagged for review.
The metrics used the following definitions:
Brand mention rate: Percentage of scheduled tests in which the tested brand was named. Tests without an AI Overview counted as no mention; technical failures were retried.
Accurate description rate: Percentage of assessable answers mentioning the tested brand in which every factual claim was verified as correct. Answers with unresolved claims were excluded from this calculation and reported separately.
Brand-owned URL cited: Percentage of answers recommending the tested brand that cited at least one page on its official website.
Average sources cited per answer: Mean number of distinct cited URLs per substantive answer, including answers with zero citations.
Cross-platform category presence: Percentage of brands mentioned for their main category prompt on all five platforms in the first run.
Citation consistency: For each prompt–platform combination, the number of URLs present in all three runs divided by the number of unique URLs cited across those runs. The reported figure was the mean across combinations with at least one citation.
Overall percentages were calculated from eligible observations across platforms, rather than by taking a simple average of platform percentages. Figures were rounded for presentation.
Mentions, recommendations, citations and website visits were recorded as separate outcomes. A citation was not counted as a website visit or a lead.
What should businesses do first?
Start by measuring, because most brands do not: McKinsey found only 16% of brands systematically track AI search performance (about 30 Fortune 500 CMOs, September 2025).
Build a prompt set from customer evidence. Use real questions from sales calls, support tickets and reviews, not only keyword lists.
Record visibility, accuracy and citations separately. Note per platform whether the brand appears, whether the description is correct, and which URLs are cited.
Measure outcomes in your own analytics. Compare AI referrals with other channels on the outcome that matters to your model, with session volume shown.
Fix specific gaps, with owners. An inaccurate price needs a page update; a missing comparison needs new content; an outdated third-party source needs outreach.
Re-test on a schedule. Repeat priority prompts monthly to separate a persistent gap from a one-off answer.
Get your baseline. We run this process for clients as a Free GEO Audit: an initial prompt baseline across major AI platforms, competitor benchmarking and checks on your priority URLs. It is a diagnostic, not a guarantee of citations or revenue. Request a Free GEO Audit and share your website, priority offering, target market and main competitors.
Methodology and sources
Freeways Agency reviewed research published between January 2025 and October 2026. For each figure we recorded the source, publication date, measurement period, population and definition. Survey results are kept separate from observed behavior, samples are never combined, and user counts with different definitions (weekly vs monthly, users vs visits) are not compared directly. Correlations are reported as associations, not causes. Interpretations and recommendations are Freeways' own; the Freeways AI Visibility Benchmark is original research described above.
Sources
Seer Interactive - AIO Impact on Google CTR: 2026 Update
Search Engine Land - Google AI Overviews CTR shows early signs of recovery
Ahrefs - AI Overviews now cost websites 58% of their clicks (press release) and full study
Adobe Digital Insights, Q1 2026 - reported by Digital Commerce 360 and Fibre2Fashion
Google AI Overviews and AI Mode user figures, Google I/O 2026 - summarized in this AI Mode explainer
Gemini 1B monthly active users - iPhone in Canada, Aug 2026
ChatGPT ~1B weekly active users - Crypto Briefing, Aug 2026
Similarweb generative AI traffic - AI News
Pew Research Center - Google users are less likely to click on links when an AI summary appears (2025)
McKinsey - consumer AI search survey (Aug 2025) and CMO survey (Sep 2025)
Ahrefs - brand factors and AI Overview visibility (May 2025); ChatGPT top-cited pages (Sep 2025); AI Overviews vs AI Mode citations (Sep 2025)

Written by Joyce Ng.
Hiring an SEO Company? Here’s What to Check Before You Sign
Compare an SEO marketing company by deliverables, pricing, proof, timelines, and red flags before signing a contract.
Top SEO Companies In 2026, A Global Shortlist By Specialty, Budget, And Business Type
Compare seo top companies by specialty, budget, proof, deliverables, and business fit before choosing an agency for 2026.

Search Engine Optimization Service Guide For 2026, Pricing, Deliverables, And What To Expect In 90 Days
Choose a search engine optimization service in 2026 with scoped pricing, deliverables, a 90-day checklist, and a fast vendor scorecard.