
Search Visibility Explained, How It Works and How to Measure It in Google Search Console

Search visibility is a practical way to track how often your site is likely to earn clicks from Google across a defined set of queries, weighted by where you rank and how much each query is searched. The confusion starts when teams mix it up with impressions, average position, or “share of voice” without agreeing on the keyword set and the weighting rule.
- Search visibility is best treated as a weighted expected-click metric across a tracked keyword set, not a single “rank” or a raw impression count.
- Different SEO tools calculate visibility differently, but most map back to the same ingredients: query importance (impressions), rank, and expected CTR.
- You can approximate and trend Google search visibility using Search Console exports plus a simple spreadsheet workflow, without paid tools.
Search Visibility Meaning, and What It Is Not
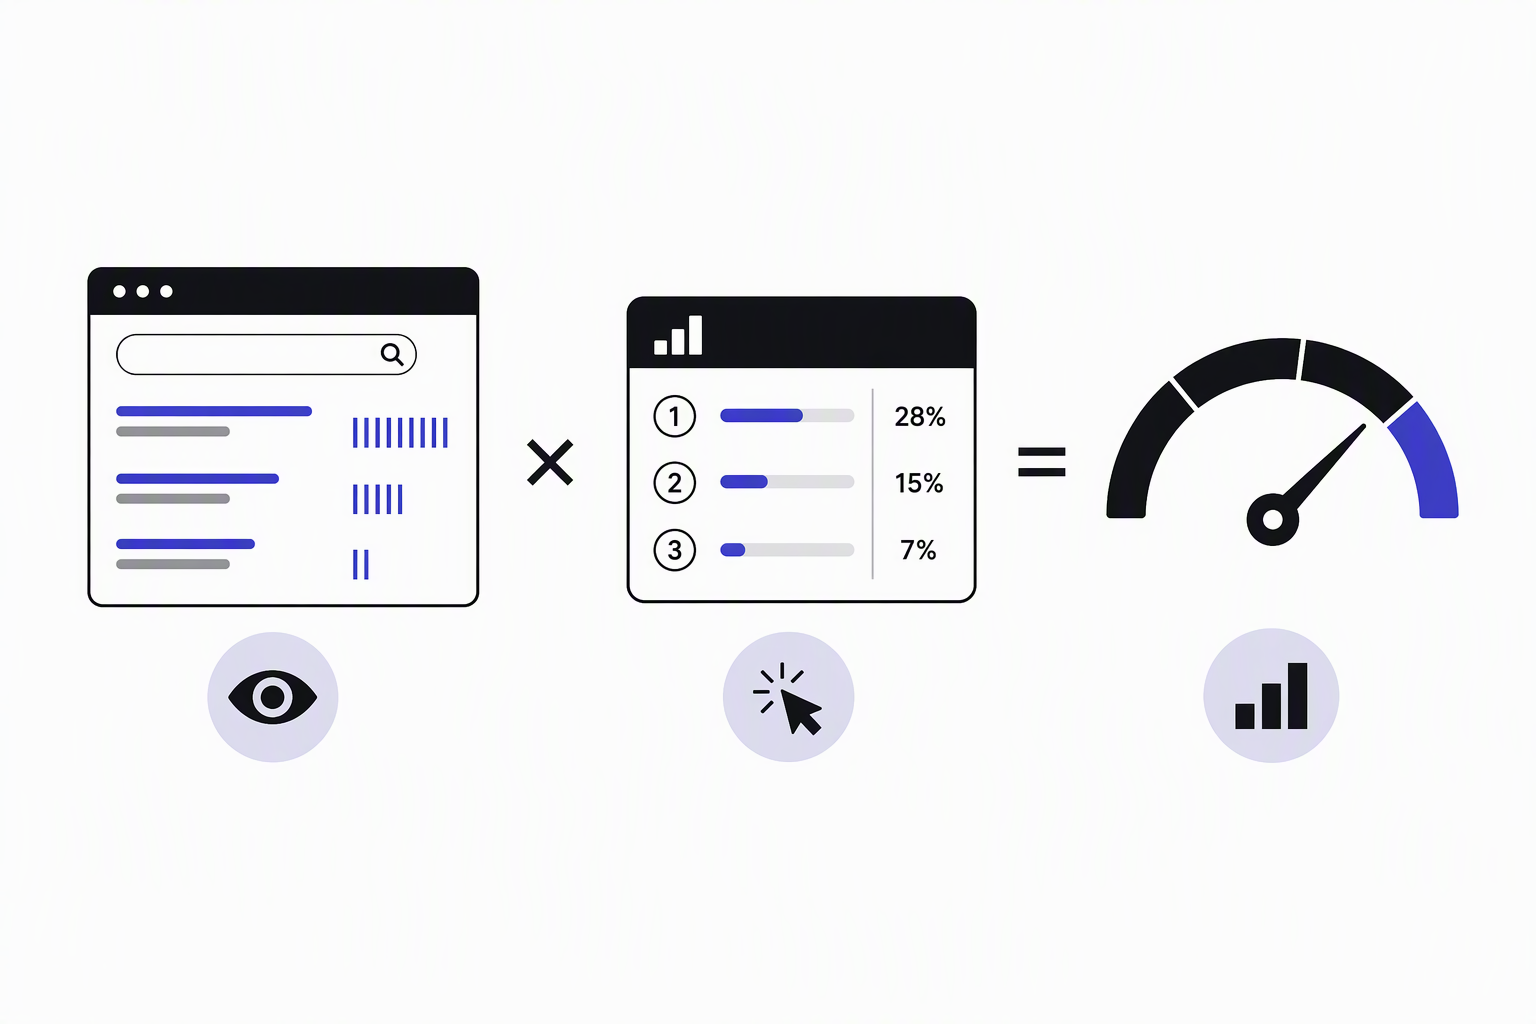
Search visibility is a keyword-set level metric that estimates your expected click share from organic search, based on where you rank and how important each query is. Treat it as a repeatable mental model rather than a “true” Google metric, because Google does not publish an official visibility score.
What “search visibility” should mean in plain terms
A useful definition that works across most SEO setups is:
- Visibility = expected clicks you would earn from your tracked queries
- Weighted by each query’s importance (commonly impressions, sometimes search volume)
- Relative to an ideal baseline (often “ranking #1 for every tracked query”)
In practice, you pick a keyword set (for example, 200 non-brand queries that represent your product categories) and compute a single score that goes up when you improve rankings on queries that matter.
What it is not (common mix-ups)
- Not impressions: impressions can rise because Google shows you more often, even if you do not win clicks.
- Not average position: an average can “improve” while you lose traffic if you drop on head terms and gain on tiny long-tail queries.
- Not total clicks: clicks are the outcome, but they are affected by seasonality, SERP changes, and demand shifts beyond SEO.
- Not a universal score: a “40% visibility” means nothing unless you know the tracked keyword set and how it is weighted.
Disambiguation for unrelated “visibility” searches
People also use “visibility” to mean different things, so if your goal is something else, you are in the wrong place:
- App visibility: ASO for App Store or Google Play rankings.
- Social visibility: Twitter/X or TikTok reach and impressions.
- Phone number lookup visibility: “Getcontact visibility” or privacy settings.
How Search Visibility Is Calculated Across SEO Tools
Most visibility formulas are different wrappers around the same three inputs: query importance, your rank, and an expected CTR curve by position. Once you standardize those inputs, tool-to-tool differences become easier to reconcile.
The standard mental model (tool-agnostic)
Use this as the neutral model you can explain to stakeholders:
- Choose a keyword set (the “tracked universe”).
- Assign a weight per query (impressions from GSC, or external volume).
- Map rank to expected CTR using a curve (your own, or a generic one).
- Compute expected clicks for each query, then sum across all queries.
- Normalize by a baseline to express a percentage (optional but useful).
Why tools disagree (and how to translate them)
Here is how the common versions relate to the same model:
- Impression share style: weights by impressions and uses a “visible if in top N” rule. This is simpler, but it treats rank 1 and rank 9 as identical if both count as “visible.”
- CTR-weighted rank style: weights by query importance and uses a CTR curve so higher positions matter more. This is closer to expected clicks.
- Click share style: uses actual clicks rather than expected CTR. This is great for reality checks, but it can understate opportunity if you rank in positions where CTR is suppressed by SERP features.
We initially assumed “visibility” was mostly a branding metric, but once our team aligned on a fixed keyword set and an impressions-based weighting, the score became a dependable trend line that matched real click changes during technical and on-page releases.
A lightweight formula you can reuse
If you want one simple spreadsheet-friendly version, use:
- Weight = GSC impressions for the query in the period
- Expected CTR = a lookup based on average position buckets (1, 2, 3, 4-5, 6-10, 11-20, 21+)
- Expected clicks = impressions × expected CTR
- Search visibility % = (sum expected clicks) / (sum impressions × CTR at position 1)
This will not be perfect for every SERP, but it is consistent, which is the real requirement for tracking.
Google Search Visibility In Search Console, A No-Tool Way To Track It
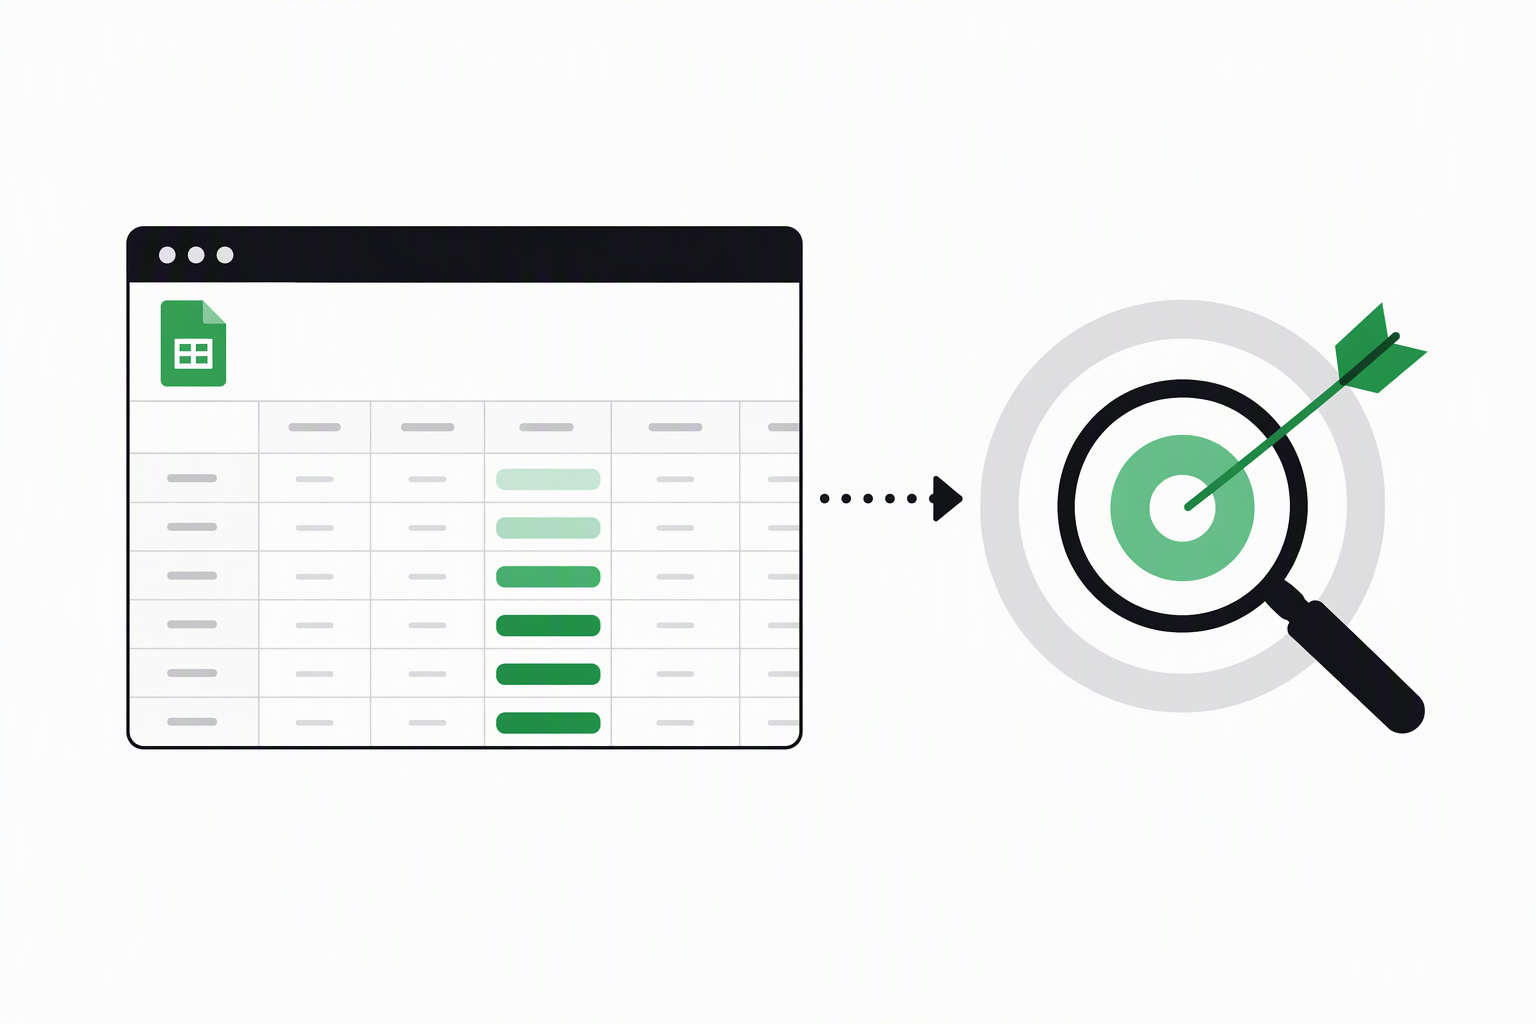
Google Search Console can be used to approximate search visibility by exporting queries and building an impressions-weighted expected-click index in a spreadsheet. The goal is not an “official” number, but a repeatable score that trends up when you win higher-value rankings.
Step 1: Export the right GSC data (repeatable settings)
- Open Google Search Console and go to Performance and then Search results.
- Set Search type = Web.
- Set a Date range you will reuse every time (for example, last 28 days). Consistency matters more than the “best” range.
- Optionally add filters: country, device, or page folder, but keep them stable across months.
- Go to the Queries tab and click Export (Google Sheets or CSV).
Step 2: Build a tracked keyword set (do not track “everything”)
Your tracked set should reflect what you want to grow. A practical starter structure is:
- Brand queries: contain your brand name or product name.
- Non-brand core: the 50 to 300 queries most aligned with your core pages and revenue intent.
- Long-tail discovery: optional, but separate, so it does not dilute the score.
In our experience working with smaller sites, visibility improves faster when the tracked set is intentionally narrow at first, because the team can connect page changes to score changes without noise.
Step 3: Create a simple CTR curve table (you control the assumptions)
Create a second sheet called CTR Curve with buckets like this:
- Position 1
- Position 2
- Position 3
- Positions 4 to 5
- Positions 6 to 10
- Positions 11 to 20
- Positions 21+
Fill in CTR assumptions that you will keep consistent over time. The exact percentages vary by SERP, but the point is to create a stable index for trending. If you do not want to assume any CTR values, skip CTR entirely and use the alternative “top 10 impression share” method in the table below.
Step 4: Calculate expected clicks and a visibility index
In your exported query sheet, add columns:
- Query group (Brand / Non-brand core / Long-tail)
- Position bucket (based on GSC average position)
- Expected CTR (VLOOKUP/XLOOKUP from your CTR Curve sheet)
- Expected clicks = Impressions × Expected CTR
- Max clicks baseline = Impressions × CTR(Position 1)
Then compute:
- Search visibility % (overall) = SUM(Expected clicks) / SUM(Max clicks baseline)
- Search visibility % (non-brand) = same formula, filtered to non-brand core
This gives you a single score you can trend monthly, plus brand vs non-brand splits that explain what is actually changing.
Step 5: Estimate opportunity so the metric becomes actionable
Visibility tracking is useful only if it points to what to fix next. Add two more columns:
- Opportunity tier:
- Tier A: positions 4 to 15 with high impressions
- Tier B: positions 16 to 30 with moderate impressions
- Tier C: positions 1 to 3 (defend) and 31+ (long-term)
- Page mapping: the landing page that should win the query (from GSC Pages tab, or your internal mapping)
Tier A is where we usually focus first because moving from the bottom of page 1 or top of page 2 tends to change expected clicks meaningfully, even without any new pages.
What Is A Good Search Visibility Score, A Practical Benchmarking Rubric
A good search visibility score is one that trends upward for the same keyword set, with separate targets for brand and non-brand queries, because those behave very differently. Benchmarks only make sense once you lock the tracked universe and keep the calculation method consistent.
First benchmark: validate your keyword set design
Before you set goals, confirm the set is not biased:
- Coverage: at least 1 to 3 representative queries per important page template (category, service, product, guide).
- Mix: include both head terms and a layer of mid-tail terms (so the score is not dominated by a few queries).
- Stability: avoid adding or removing many keywords month to month, or the trend line becomes meaningless.
A simple rubric you can use without competitor tools
- Healthy: non-brand visibility rising steadily over multiple check-ins, while brand visibility remains stable or grows with demand.
- Needs investigation: visibility rises but clicks do not, which often means SERP features changed, intent mismatch, or snippet/CTR issues.
- At risk: visibility drops in the non-brand core group, especially concentrated in a few high-impression queries or one page folder.
What surprised our team was how often a “flat” overall score hid a real win: brand visibility dipped due to seasonality while non-brand visibility improved, which was the actual SEO progress we wanted to protect.
Brand vs non-brand targets (how to set realistic expectations)
Instead of chasing a universal number, set two targets:
- Brand: aim for consistency and coverage (you should appear for your own name and key branded variants). Big changes are often driven by PR, ads, or seasonality rather than SEO work.
- Non-brand: aim for sustained quarter-over-quarter improvement in the core set, plus shrinking the count of high-impression queries stuck in positions 8 to 20.
| Measurement approach | What you calculate | Best for | Main limitation |
|---|---|---|---|
| CTR-weighted visibility index (recommended) | SUM(impressions × expected CTR by position) normalized to a position-1 baseline | Trending search visibility over time and spotting wins on high-impact queries | CTR curve is an assumption, so treat it as an index, not an absolute truth |
| Top-10 impression share (no CTR assumptions) | SUM(impressions where position ≤ 10) / SUM(all impressions in the tracked set) | Quick directional tracking when you want a simpler method | Does not differentiate position 1 from position 9 |
| Click share (outcome) | SUM(clicks in tracked set) / SUM(clicks + estimated opportunity) | Reality checking whether visibility translates into traffic | Sensitive to seasonality and SERP changes; harder to compare period to period |
FAQ about search visibility
If you want a second set of eyes on your keyword set design and a clean baseline for search visibility, Freeways can run a free audit using your exported Search Console data, then recommend the highest-leverage on-page and internal linking changes to lift the score over the next reporting cycles.

Written by Joyce Ng.
Technical SEO Explained, How It Works, What to Fix First, and Why It Matters
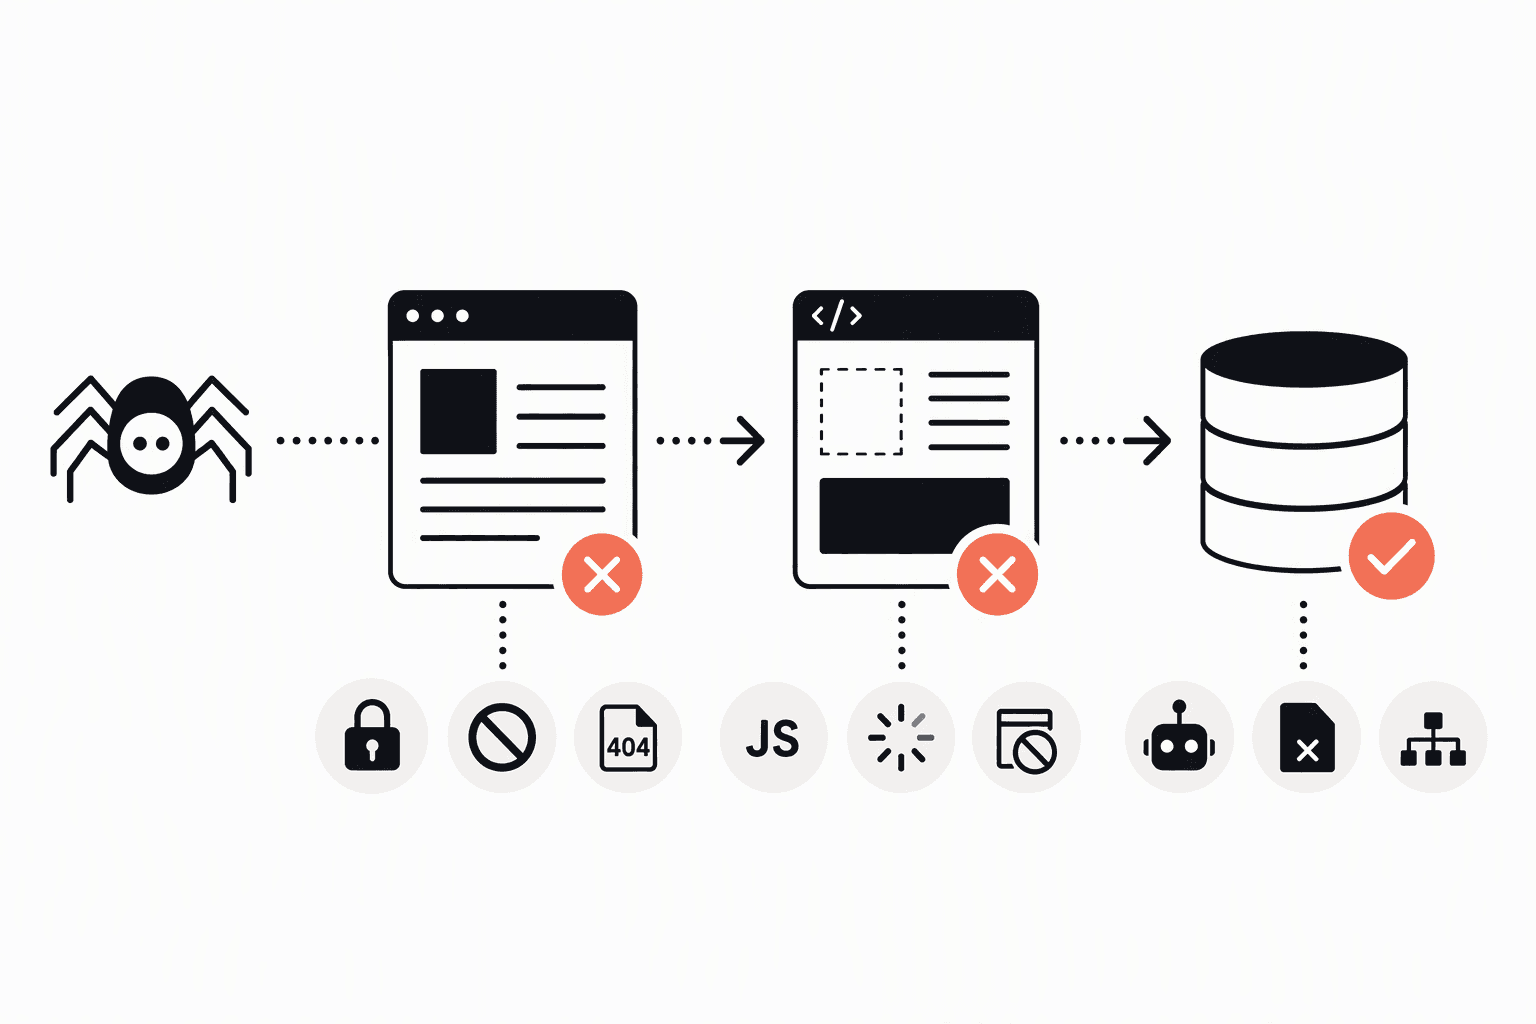
Learn technical seo basics, how crawl-render-index works, what breaks it, and a prioritized checklist to fix issues fast using GSC.

Semantic SEO Explained for 2026, The Practical Blueprint to Rank Beyond One Keyword
Learn semantic seo in 2026 with a practical blueprint: intent, entities, deliverables, examples, and a QA checklist to publish with confidence.

Website Technical SEO, A Practical Framework Plus Real Fix Examples
Learn website technical seo with an Impact–Effort–Risk framework, a starter audit workflow, and 5 real fix examples with validation steps.